If you need to work with weather data for your data analysis, this post will help you with the process. It utilizes the basics of Python and Pandas for basic analysis of weather data. You will learn how to merge the weather data with your other datasets, perform basic data checks, generate simple plots, and prepare a file for further work with your data such as model fitting.
In the example, we will use a dataset containing randomized minute transportation data from various companies. We assume you have already installed Python on your computer and know how to run it and install libraries using the pip command.
Preprocess the data for your analysis
First, you will need to load your dataset from a CSV file saved on your PC.
   import numpy as np
   import pandas as pd
   from scipy import stats
   import matplotlib.pyplot as plt
   import seaborn as sns

   # Load data from csv
   df = pd.read_csv('tranportation_data.csv')

   # Show data sample to see what we have
   df
This will show you your imported data which might look like as in our example dataset - our example data contain a timestamp in UNIX format (UTC timezone), distance in miles, and price in USD:
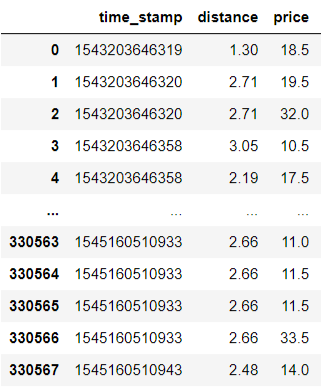
As we have data in the UNIX timestamp, we will easily convert them to datetime object:
df['time_stamp'] = pd.to_datetime(df['time_stamp'], unit='ms', origin='unix', utc=True)
How to add weather for your data analysis
The easiest way to add weather data to your dataset is through weather API when using one of the prepared easy-to-use wrapper libraries. When using Python, install pymeteosource with pandas support using the following command:
pip3 install pymeteosource[pandas]
Then you will need to get your unique API key to be able to download weather data - you will find more information about data and API plans at API plans and pricing page.
When you have your API key ready, check what dates you have the data for in order to know what time range we need to extract from Meteosource. You can either download the data directly in your timezone or convert them later. For our example, we will download the weather data in the UTC timezone and convert the timezone when we merge the data.
Run the following commands to download your weather data:
   from datetime import datetime, timedelta
   from pymeteosource.api import Meteosource
   from pymeteosource.types import tiers, units

   # Change this to your actual API key
   YOUR_API_KEY = 'YOUR API KEY'
   # Change this to your actual tier
   YOUR_TIER = tiers.FLEXI

   # Initialize the main Meteosource object
   ms = Meteosource(YOUR_API_KEY, YOUR_TIER)

   # The date range for our dataset
   date_from = df.time_stamp.min().strftime('%Y-%m-%d')
   date_to = df.time_stamp.max().strftime('%Y-%m-%d')

   # Get the historical weather data
   tm = ms.get_time_machine(date_from=date_from, date_to=date_to,
                         place_id='boston', tz='UTC',
                         units=units.US)

   # Convert the result to pandas
   weather = tm.to_pandas()
Data checks and plotting
Run the following command to see what weather data we have, we can just print the columns of the weather dataframe:
   # See what weather variables we have
   weather.columns
If you decide that you need only some of the weather variables, you can select only those that correlate with your dataset.
   # We only need some of the weather variables
   weather = weather[['cloud_cover_total', 'weather', 'precipitation_total', 'temperature', 'wind_speed']]
Now we can visualize some of the weather data to see if they are correct.
   # Plot frequencies of weather types
   weather_cats = weather['weather'].value_counts().reset_index()
   weather_cats.columns = ['weather', 'count']

   sns.set(rc={'figure.figsize': (12, 6)})
   plt.xticks(rotation=90)
   sns.barplot(x=weather_cats['weather'], y=weather_cats['count'])
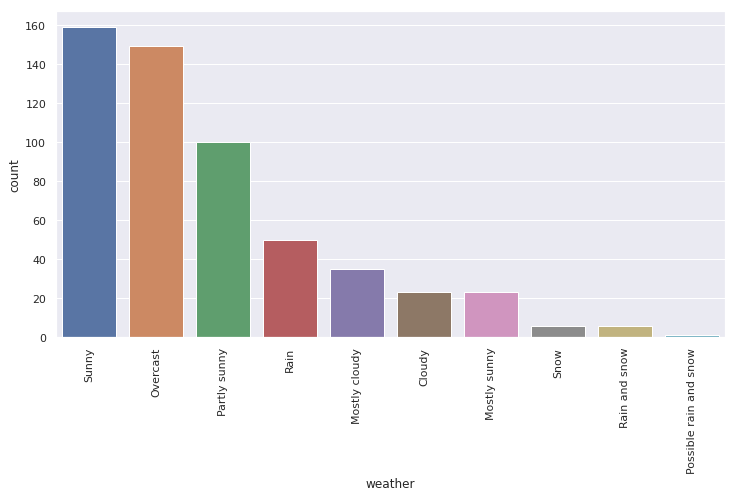
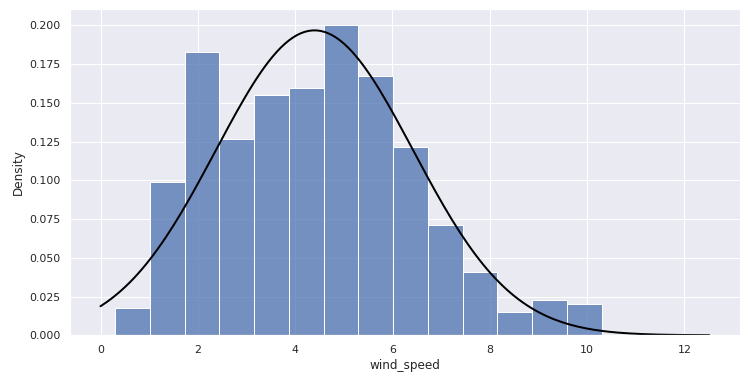
The first example (above) shows the frequency of predefined weather types - this will give us an idea of what weather is more common in our location and how to structure our analysis. We can also see a distribution of any variable in our dataset (example below) to better understand our data.
   # Plot distribution of weather data
   def normal(mean, std, color="black"):
       x = np.linspace(mean - 4 * std, mean + 4 * std, 200).clip(0, None)
       p = stats.norm.pdf(x, mean, std)
       z = plt.plot(x, p, color, linewidth=2)

   ax = sns.histplot(x=weather.wind_speed, stat="density")
   normal(weather.wind_speed.mean(), weather.wind_speed.std())
Merge weather data with your dataset for analysis
Our transportation company data with timestamps have a resolution in seconds. The weather data we have are hourly. To merge the data, we have to round the ride timestamps to the nearest hour. Then we will merge the DataFrames. We will use the time_stamp column in the transportation data, and the index of the weather dataset to perform the merge. Lastly, we convert the datetimes to our local timezone, for example US/Eastern.
   # First we have to round the date_times in the transportation dataset to the nearest hour to match weather data
   df['time_stamp'] = df['time_stamp'].dt.round('H')

   # Now we can merge the data
   data = pd.merge(df, weather, left_on='time_stamp', right_index=True, how='left')

   # We can also convert the time_stamp column from UTC to local timezone (e.g. US/Eastern)
   data['time_stamp'] = data['time_stamp'].dt.tz_convert('US/Eastern')
Need more weather for your data analysis?
In the example, we discussed the basics of data preparation for your analysis and how you can utilize wrapper libraries to easily work with the data in Python. If you find you need more weather data than offered in Meteosource's standard plans, please get in touch with your needs. We also help businesses in various sectors with our machine learning applied models.


