Weather Maps & Tiled Layers
Included in Weather maps API
Available for Standard and Flexi plans
Receive various weather map layers for current and forecasted weather. You can choose from the most useful variables and obtain all data using one simple URL.
Global radar, temperature, rain, clouds and other variables are available in high-resolution and are ready to be overlaid within mapping applications for easy implementation.
Map availability through subscriptions
We provide several data resolutions based on a chosen subscription plan.
| Subscription plan | Weather Maps & Layers |
|---|---|
| Free | |
| Start up | |
| Standard | |
| Flexi |
Subscription plans and pricing
Supported integration of map layers
Following map SDKs are supported by Meteosource API.


Google Maps Weather API Integration
<html>
<head>
    <title> Meteosource API | Google Maps API Integration </title>
    <script src="https://polyfill.io/v3/polyfill.min.js?features=default"></script>
    <style>
    #map {
        height: 100%;
    }

    html,
    body {
        height: 100%;
        margin: 0;
        padding: 0;
    }
    </style>
    <script>
    const METEOSOURCE_API_KEY = "YOUR-API-KEY";

    function initMap() {
        let map = new google.maps.Map(document.getElementById("map"), {
            center: {
                lat: 51.5,
                lng: 0
            },
            zoom: 6,
        });
        var rainMapOverlay = new google.maps.ImageMapType({
            getTileUrl: function(coord, zoom) {
                return 'https://www.meteosource.com/api/v1/flexi/map?key=' + METEOSOURCE_API_KEY + '&tile_x=' + coord.x + '&tile_y=' + coord.y + '&tile_zoom=' + zoom + '&datetime=+1hour&variable=temperature'
            },
            tileSize: new google.maps.Size(256, 256)
        });
        map.overlayMapTypes.insertAt(0, rainMapOverlay)
    }
    window.initMap = initMap;
    </script>
</head>

<body>
    <div id="map"></div>
    <!-- replace with your Google Maps API key, get one at https://developers.google.com/maps/documentation/javascript/get-api-key -->
    <script src="https://maps.googleapis.com/maps/api/js?key=YOUR_GOOGLE_MAPS_API_KEY&callback=initMap&v=weekly" defer></script>
</body>

</html>
Mapbox Weather API Integration
<!DOCTYPE html>
<html>
<head>
    <title> Meteosource API | Mapbox GL API Integration </title>
    <meta charset="utf-8">
    <meta name="viewport" content="initial-scale=1,maximum-scale=1,user-scalable=no">
    <link href="https://api.mapbox.com/mapbox-gl-js/v2.10.0/mapbox-gl.css" rel="stylesheet">
    <script src="https://api.mapbox.com/mapbox-gl-js/v2.10.0/mapbox-gl.js"></script>
    <style>
    body {
        margin: 0;
        padding: 0;
    }

    #map {
        position: absolute;
        top: 0;
        bottom: 0;
        width: 100%;
    }
    </style>
</head>

<body>
    <div id="map"></div>
    <script>
    const METEOSOURCE_API_KEY = "YOUR-API-KEY";
    const MAP_API_KEY = "YOUR-API-KEY";

    mapboxgl.accessToken = MAP_API_KEY;

    const map = new mapboxgl.Map({
        container: 'map', // container ID
        // Choose from Mapbox's core styles, or make your own style with Mapbox Studio
        style: 'mapbox://styles/mapbox/streets-v11', // style URL
        center: [0, 51.5], // Initial longitude, latitude
        zoom: 6 // Initial zoom
    });
    map.on('style.load', () => {
        map.addSource('raster-tiles', {
            'type': 'raster',
            'tiles': ['https://www.meteosource.com/api/v1/flexi/map?key=' + METEOSOURCE_API_KEY + '&tile_x={x}&tile_y={y}&tile_zoom={z}&datetime=now&variable=temperature'],
            'tileSize': 256,
        })
        map.addLayer({
            'id': 'simple-tiles',
            'type': 'raster',
            'source': 'raster-tiles',
            'minzoom': 0,
            'maxzoom': 22
        }, )
        map.setFog({}); // Set the default atmosphere style
    });
    </script>
</body>

</html>
Here Maps Weather API Integration
<!DOCTYPE html>
<html>
<head>
    <title> Meteosource API | HERE Maps API Integration </title>
    <meta name="viewport" content="initial-scale=1.0,
        width=device-width" />
    <script src="https://js.api.here.com/v3/3.1/mapsjs-core.js" type="text/javascript" charset="utf-8"></script>
    <script src="https://js.api.here.com/v3/3.1/mapsjs-service.js" type="text/javascript" charset="utf-8"></script>
    <script type="text/javascript" src="https://js.api.here.com/v3/3.1/mapsjs-mapevents.js"></script>
    <script src="https://js.api.here.com/v3/3.1/mapsjs-ui.js" type="text/javascript" charset="utf-8"></script>
    <link rel="stylesheet" type="text/css" href="https://js.api.here.com/v3/3.1/mapsjs-ui.css" />
</head>

<body>
    <div style="position: absolute; width: 90%; height: 90%; left: 5%; top: 5%;" id="mapContainer"></div>
    <script>
    const METEOSOURCE_API_KEY = "YOUR-API-KEY";
    const MAP_API_KEY = "YOUR-API-KEY";

    var platform = new H.service.Platform({
        'apikey': MAP_API_KEY
    });

    // Obtain the default map types from the platform object:
    var defaultLayers = platform.createDefaultLayers();
    // Instantiate (and display) a map object:
    var map = new H.Map(document.getElementById('mapContainer'), defaultLayers.vector.normal.map, {
        zoom: 6,
        center: {
            lat: 51.5,
            lng: 0
        }
    });
    var behavior = new H.mapevents.Behavior(new H.mapevents.MapEvents(map));
    let tileProvider = new H.map.provider.ImageTileProvider({
        getURL: function(column, row, zoom) {
            return 'https://www.meteosource.com/api/v1/flexi/map?key=' + METEOSOURCE_API_KEY + '&tile_x=' + column + '&tile_y=' + row + '&tile_zoom=' + zoom + '&datetime=+1hour&variable=temperature'
        }
    })
    var overlayLayer = new H.map.layer.TileLayer(tileProvider);
    map.addLayer(overlayLayer)
    </script>
</body>

</html>
ArcGis Weather API Integration
<html>
<head>
    <title> Meteosource API | ArcGIS JS API Integration </title>
    <meta charset="utf-8" />
    <meta name="viewport" content="initial-scale=1,maximum-scale=1,user-scalable=no" />
    <style>
    html,
    body,
    #viewDiv {
        padding: 0;
        margin: 0;
        height: 100%;
        width: 100%;
    }
    </style>
    <link rel="stylesheet" href="https://js.arcgis.com/4.24/esri/themes/light/main.css" />
    <script src="https://js.arcgis.com/4.24/"></script>
    <script>
    const METEOSOURCE_API_KEY = "YOUR-API-KEY";

    require(["esri/Map", "esri/views/MapView", "esri/layers/WebTileLayer"], (Map, MapView, WebTileLayer) => {
        const map = new Map({
            basemap: "topo-vector"
        });
        const view = new MapView({
            container: "viewDiv",
            map: map,
            zoom: 6, // Initial zoom
            center: [0, 51.5] // Initial longitude, latitude
        });
        let layer = new WebTileLayer({
            urlTemplate: 'https://www.meteosource.com/api/v1/flexi/map?key=' + METEOSOURCE_API_KEY + '&tile_x={col}&tile_y={row}&tile_zoom={level}&datetime=+1hour&variable=temperature'
        });
        map.layers.add(layer);
    });
    </script>
</head>

<body>
    <div id="viewDiv"></div>
</body>

</html>
You can find more information about implementation in several mapping platforms in our documentation.
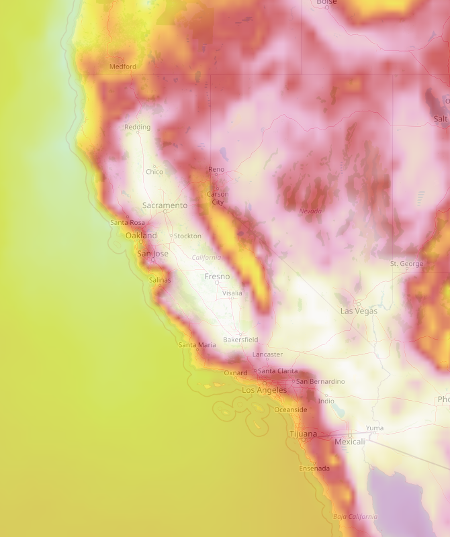
Available resolution - examples
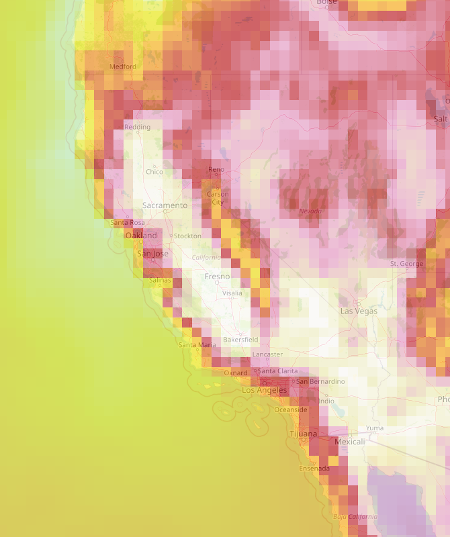
0.5° resolutions
Standard plan
Full resolution
Flexi plan
Available data
Weather maps API includes the following layers:
- temperature 2 metres above ground
- feels like temperature
- percentage of sky covered by clouds
- total precipitation amount accumulated since last hour
- wind speed 10 metres above the ground
- wind gust speed
- atmospheric pressure at mean sea level
- relative humidity
- wave height
- wave period
- sea temperature (available only for +-24 hours)
More layers are available upon request.